Economy Summary
Orange County’s quality of life based on economic indicators was somewhat mixed in the period between the 2015 Quality of Life Report and this Report Card. Like all of the Hudson Valley counties, unemployment remained relatively low during the time period, with spikes attributable to the COVID-19 pandemic. Average employment growth between 2014 and 2024 increased by 8.5%, ranking fourth among all the Hudson Valley counties.
Industries that are strongest in Orange County’s employment statistics remained healthcare & social assistance and retail, which together represent 34.5% of total private sector jobs, an increase since 2006 of 4.1%. While data on employment in industries related to the environment, such as waste recycling, waterbody testing, etc., does not surface in most data sources, it is important to acknowledge the contribution of this employment to Orange County’s economic well-being and is represented by data on “green jobs” in the Hudson Valley. Orange County experienced strong net employment growth between 2014 and 2024, up 14.2%. Sullivan County experienced the highest net employment growth during the same time period at 23% while Ulster County was weakest at 1.4%.
From 2014 to 2024, the average annual wage increased by 48.1% in Orange County, while median income was up by 52.9% between 2005 and 2023. The government sector reported the greatest increase in average wages.
Affordable housing and housing availability remain a concern in Orange County. While in previous reports, the median price of housing was affected by recessions, in 2025, median housing prices are more than 50% higher than in 2005. Vacancy rates for housing remained relatively unchanged in 2010, 2012, and 2020, as did homeownership during the same time period. The number of housing permits continued to increase with a high of 2,172 in 2024, up from 1,445 in 2023 and 1,608 in 2001, the earliest year data was collected for this Report.
In 2023, 40% of Orange County homeowners were in financial distress (spending 30% or more of income on housing), down from a high of 45% from 2010 through 2014. Homeownership rates have remained steady, at 71% in 2015 through 2017, dipping to between 69-70% in 2018-2020, and increasing again to 71% between 2021 and 2023. The available inventory of single-family and condominiums and townhomes dropped dramatically between 2016 and 2025, from a high of 2,676 in July 2016 to 961 in July 2025. On the rental stage, vacancy rates have declined from 4.61% in 2009 to 2.07% in 2019. In 2009, renters paid 29.3% of median income in rent while they paid 33.6% of median income in 2019.
Tourism has grown significantly in Orange County since the first Quality of Life Report Card was published. All counties measured, except for Putnam County, experienced significant tourism growth. Orange County’s tourism revenue peaked in 2019 and continues to see an upward trend after declines attributable to COVID-19.
Additionally, film production has exploded in Orange County and much of the Hudson Valley region since 2016, when New York State amended the New York State Film Production Tax Credit so that the 40% tax credit on qualified labor expenses would apply to Hudson Valley counties, including Orange, Putnam, Dutchess, Sullivan, Ulster, and others.
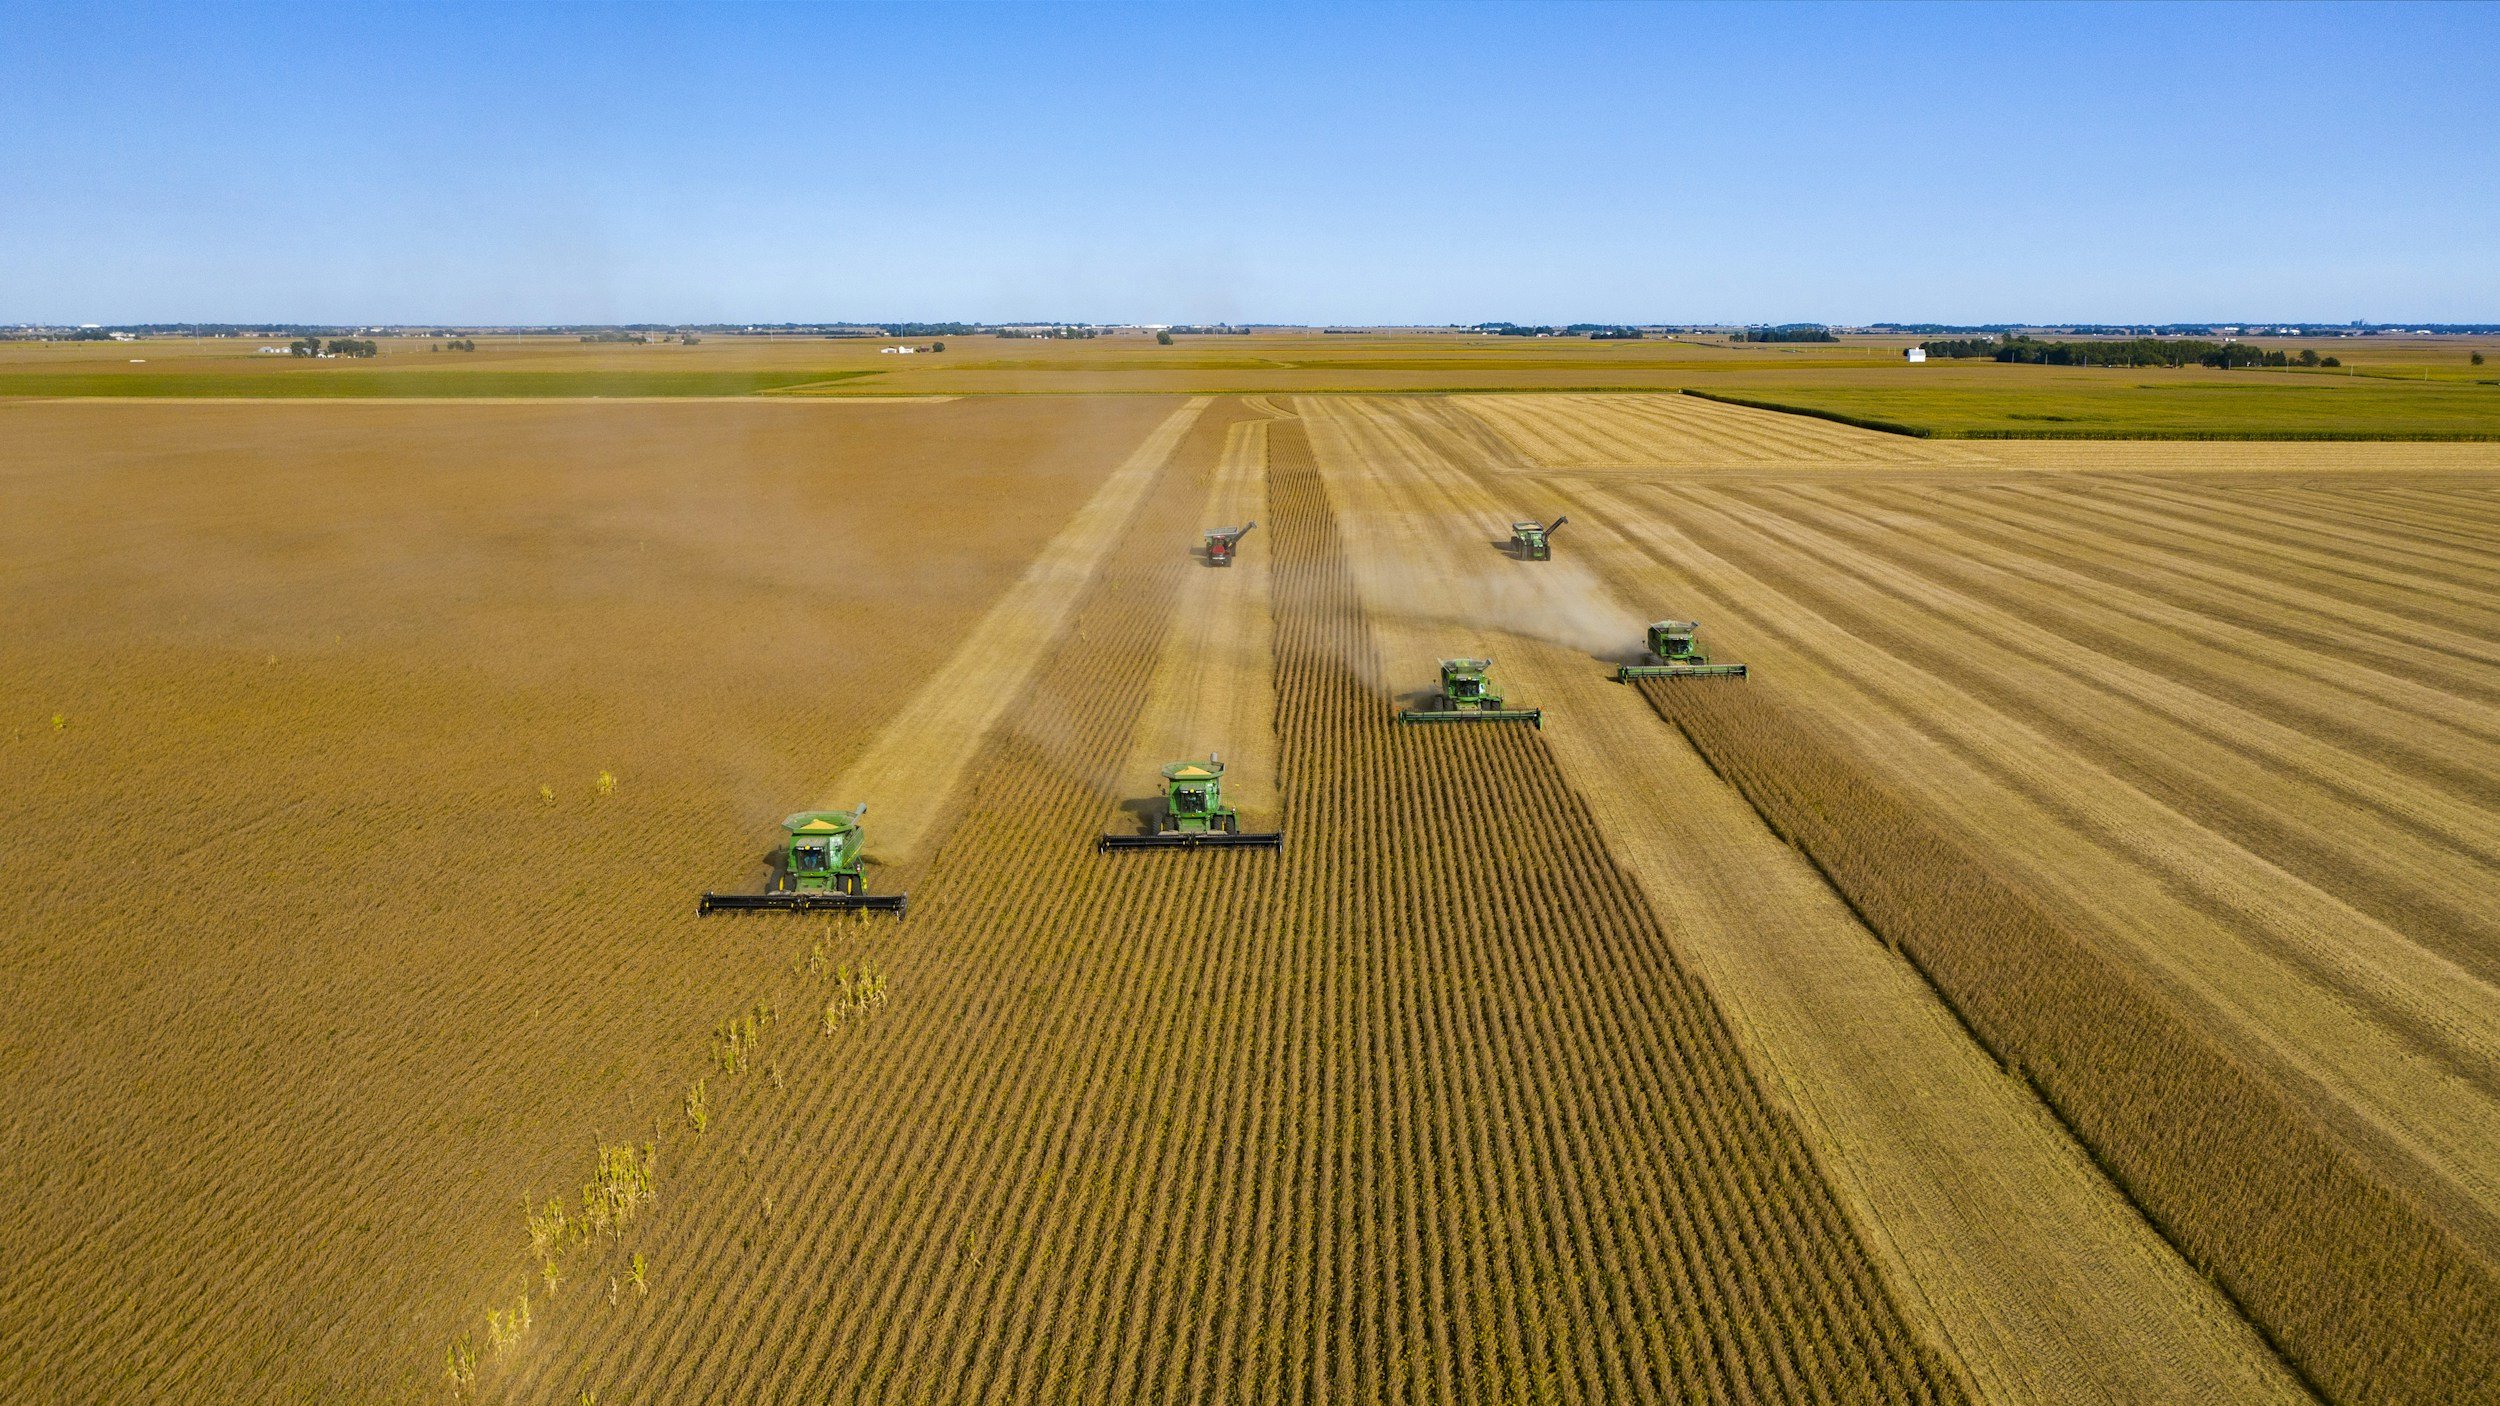
The farm community, while experiencing increases in farm size and the number of farms from 2007 to 2012, is once again on a downward trend. Approximately 13% of all of Orange County’s land area is agricultural. Overall, the number of farms dropped by 13% between 2002 and 2022, and the average size of farms in Orange County, from an acreage standpoint, dropped 39% in the same period. During the same time, however, the market value of agricultural products sold rose 44%, the second highest in the Mid-Hudson region. Additionally, Orange County has been among the highest in volume of major agricultural products sold each year for the past 15 years.